Detailed rule performance analytics added to the dashboard
We recently released the slotting Rule Performance page to measure how slotting rules affect add to carts (ATC), and now the analytics are even more detailed! The new summary statistics and time series view will help merchandisers make data informed decisions to optimize business KPIs and merchandising rules. Clicking on the more information arrow on specific rules will allow you to view the detailed statistics on rule performance.


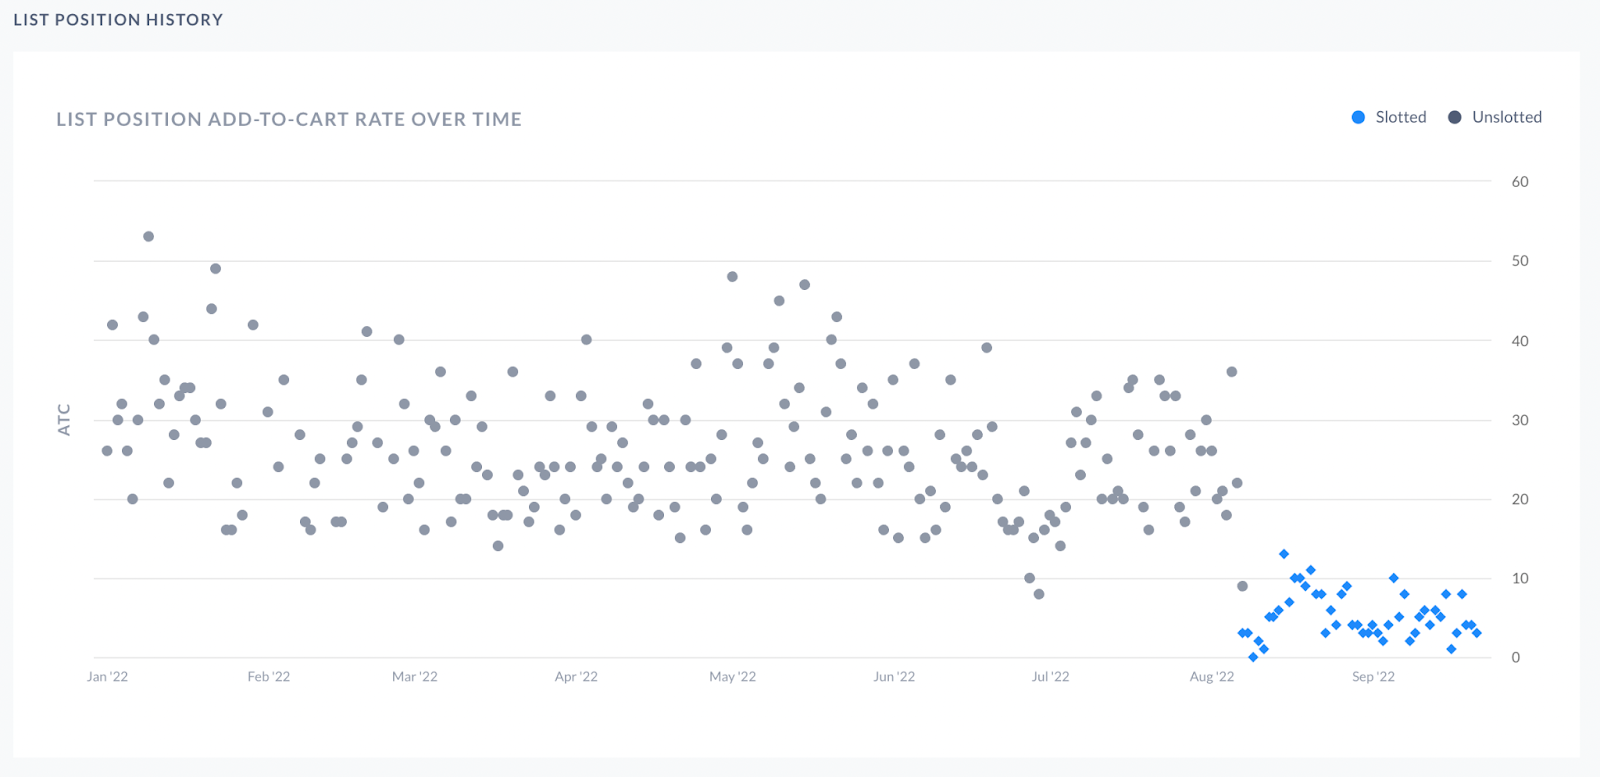
Below the summary statistics is a time series chart showing the daily conversion totals from slotted and unslotted results. The chart below shows that once the product was slotted (represented by the blue dots), the performance dropped off significantly from past performance (represented by the gray dots) when the position was not slotted.